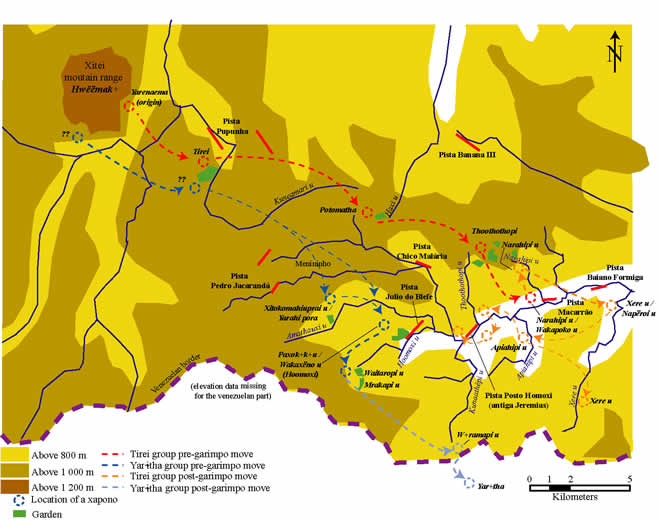
Spatial distribution and extent of habitat types and Yanomami communities at Homoxi
Landsat images and the Yanomami population
This subject has been addressed by Nathan Craig and Napoleon Chagnon (Craig & Chagnon, 2000). These authors recommend the usefulness of these techniques for evaluating Yanomami populations on account of the fact that communities are spread over a vast area but generally of a size compatible with the resolution of the images (approx. 30m). Nevertheless, on account of the complexity of the images, they suggest a series of treatments (NDVI, PCA, SMA etc.) to facilitate the differentiation between settlements and other artefacts. Two signs of indigenous occupation are thought to be detectable: the swidden clearings for Yanomami gardens and the settlement clearings themselves (with communal roundhouses).
In the Homoxi region we have conducted a series of tests to determine the value of these treatments in interpreting the images. Although the use of a vegetation index suitable for differentiating depauperate vegetation (secondary forests resulting from Yanomami agriculture or mining) and shaded slopes has been shown to be conclusive, the other treatments provide little more information than a visual interpretation of a combination of bands 3, 4, and 5.[1] In addition, visual interpretation allows the use of criteria other than the radiometry of the pixels in the differentiation of objects, in particular their shape or size, making mapping work much more efficient and allowing the differentiation of equivalent objects according to their origins (established from other sources). Thus, for example, secondary forests in old indigenous gardens can be distinguished from those resulting from mining (see below).
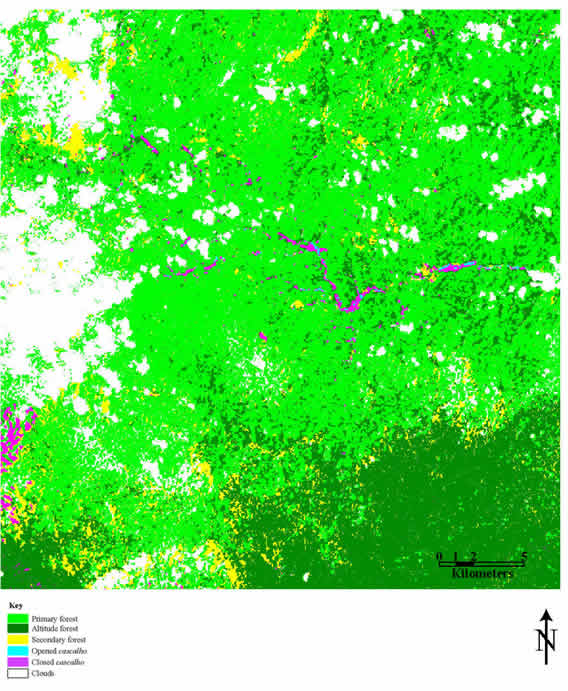
Interpretation of the images has shown that it is relatively easy to detect indigenous gardens. These show themselves either as areas of bare soil (at the time of clearing) or, much more often, as depauperate vegetation or secondary forest whose behaviour in Band 5 (strong reflection) allows them to be differentiated easily from primary forests. This is explained by the agricultural practices of the Yanomami, which involve the annual felling of a small patch of forest that is only bare for the short period between the felling and burning in the dry season and the growth of crops in the rainy season. The choice of crop species (including fruit trees such as pawpaw, peach palm and bananas and dense cover species such as manioc) explains why, when seen from the Landsat TM, the greater part of these gardens show up as low-density forest.
The recuperating clearings can be distinguished from primary forest for a long time. Once abandoned, the area is colonised by typical secondary forest trees such as Cecropia sciadophylla (embauba) together with surviving fruit trees such as Bactris gasipaes (pupunha). These form a flat canopy composed of trees of the same age, which looks very uniform from above. The difference in tree sizes found in primary forest (with the consequent shadow cast by the taller species) is absent from these secondary forests, explaining the strong retrodiffusion observed in Band 5. Twenty years or more will have passed before primary forest species begin to make their mark on the canopy, gradually returning it to its irregular form and pushing the spectral response back towards that of primary forest
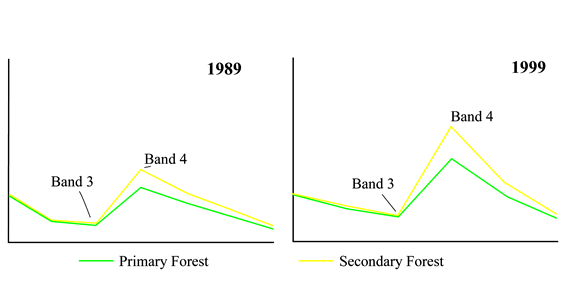
Figure 1: Spectral response for forest types at Homoxi
In any interpretation of the relationship between forest clearings and Yanomami population, it must be taken into account that the indigenous gardens observable from the images represent several cycles of Yanomami agriculture. Thus in the Homoxi region (in the broad sense) there are only three communities but seven detectable areas of slash-and burn agriculture. Each group thus has more than one area attributable (the areas where they are currently living and those in which they lived in the past), and it is impossible to use the number of clearings alone as a means of estimating the population. Furthermore, in the Homoxi context, it must be remembered that some of the secondary forests were caused by gold mining rather than by agriculture.
Although the detection of gardens is relatively easy this is not the case for the communal roundhouses (yanos or xabonos), probably because the majority of these houses are relatively small in the region. The style of large, open houses enclosing the whole community, as used in the lowlands at Demini, has only recently been adopted by one of the Homoxi communities (Tirei). These are too small to be detected on high resolution images.
The visual method of interpretation is not without its problems, one being the amount of time that it requires and the other being the potential difference in the interpretation of the same image by two operators, or even by the same operator on different dates. In our case, however, the maps produced were generally well adapted to the level of the survey, and were thoroughly confirmed by the ground-truthing.
Landsat images and garimpeiro activity
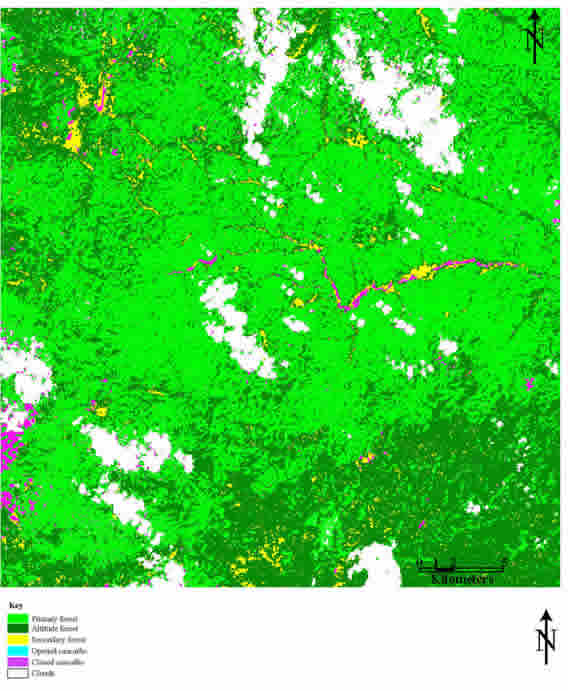
Gold mining activities are shown on the Landsat images as clearings in otherwise completely forested regions. The appearance of completely bare soils, recognisable by their characteristic radiometry, is probably the surest sign of its presence, as the type of agriculture practised by the Yanomami rarely leaves significant areas of base soil.
This distinctive sign allows us to undertake automatic interpretation of the images, but only in the Homoxi region sensu strictu. This technique would be inappropriate for the complete Landsat image, as areas of bare soil or gravel are barely distinguishable from those of the large plateaux of grassy savanna that occur elsewhere in the region, particularly after the sparse regeneration of grasses and shrubs on these gravel areas. The 1989 image shows two spectral responses in the gold mining areas, appearing in the 345 layer either as pink (truly bare soils/gravels) or blue (soils/gravels covered by herbaceous vegetation). In the 1999 image, however, shot at a time when no mining was bein undertaken the area, only the latter spectral response is present. This is due to the sparse herbaceous cover that can now be found throughout the mine workings. To limit the areas interpreted as affected by gold mining to those that show as bare soils or gravels would result in a significant underestimate. Mined areas where some organic residues have been left in the substrate, or where the proximity of the forest and associated leaf/ litter fall has encouraged regeneration, are now covered by secondary forest.
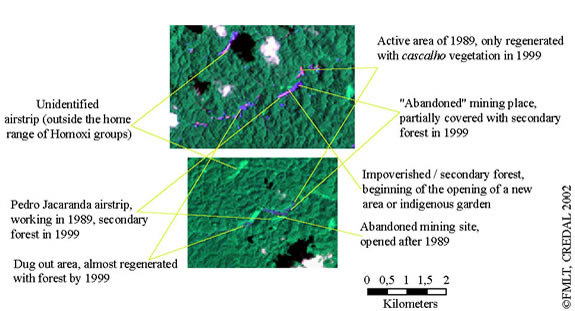
In order to evaluate the spatial impact of mining correctly, it is therefore necessary to look at the other distinctive sign of past mining activity: zones of secondary forest. Since these cannot be distinguished spectrally from those resulting from Yanomami agriculture, these regions cannot be interpreted automatically (at least without subsequent re-evaluation). Visual interpretation allows one to take into account criteria such as the shape or location of the patches, significantly reducing the risk of confusion. Thus, irregular patches of secondary forest situated along water bodies and the areas where bare soils are found (particularly in 1989) are almost certainly garimpos. Only a ground-truthing study such as the one undertaken at Homoxi, combined with aerial reconnaissance and interviews of the local population, will allow accurate distinction to be made between gardens and garimpos. Nevertheless in some cases garimpos were established in the middle of existing Yanomami gardens, rendering such distinction (and thus the assessment of the relative areas of each) impossible. Such was the case at the Macarrão and Julio de Blefe airstrips at Homoxi, where the runways were created in the middle of Yanomami settlements. Only a chronological series with a short time-lapse (e.g. every six months) between 1987 and 1991 would elucidate these matters, but, as we have seen, this would be impossible on account of the scarcity of clear images.

Figure 2: Spectral responses for gravel (cascalho) areas at Homoxi
The 1999 image shows the presence of a number of small lakes in the Homoxi region, which were formed by flooding of abandoned mine workings. These lakes became breeding sites for mosquitoes, and may also be contaminated with mercury (see following sections).
The use of supervised classification
In spite of the advantages of visual interpretation for the explanation of context, we have undertaken a supervised classification of the two images in a manner comparable with the confusion matrix method. Other methods of comparisoin could not be used since the images came from two different sources and the radiometric calibration of the two would have been very delicate.
Since the objectives of our survey were relatively limited, and there were various factors such as relief[2] to complicate an automatic classification, we preferred to undertake supervised classification of polygons that had been chosen on a visual basis. We have then used a ‘maximum likelihood’ algorhythm to undertake two classifications, which we have then cleaned of individual pixels with an adaptive filter proposed by the ENVI software. The two classifications were then automatically compared to see what proportion of the pixels of each of the classes identified from the 1989 image were found in a new class in the 1999 image. The result of this analysis is discussed in the following section.
It is necessary to stress again here the problems posed by cloud cover. In effect, as we have already pointed out, this is a significant obstacle in the acquisition of imagers in the Serra Parima. Also, the two images that are available to us are by no means clear of cloud. In the Homoxi-Xitei region, there is 13% cloud cover in the 1989 image and 9.5% in the 1999 image (see Table 2). This creates two problems: how to take account of clouds iin the classifications, and the validity of the statistical results.
Two classes for cloud areas were predicted from the classification: one for cloud itself and another for cloud shadow. However, from initial confusions it rapidly became apparent that it would be necessary to include two further classes in the classification. One of these was cloud edge which, particularly in the 1999 image, is easily confused with areas of gravel. After this was adjusted, confusions were reduced (thus halving the area of gravels detected), but a certain number of pixels appeared to be incorrectly classified, as could be seen from the resulting images. Their number is negligible in the smaller areas, but they have the overall effect of slightly reducing the result for the Xomoxi-Xitei region. Another confusion was revealed by the classification of vast areas of primary forest as secondary forest. These were areas where slight haze had modified the spectral response. Once the additional class was created this problem was resolved, aty the cost of greatly increasing the amount of area classified as ‘clouds’.
The bias due to these cloud-cover adjustments should be borne in mind when considering the comparisons discussed below. In effect, around 10% of the study area from each image cannot be used, and only 10% of these clouds are in the same place in both images. Thus, for example, there are areas that were known to be open gravels in 1989 but we cannot know what they had become by 1999 on account of the clouds. In order to help clarify the degree of unknown, we have included the areas covered by cloud in the tables below.
Table 1: Results of classifications of the Homoxi-Xitei zone (126,700 ha)
|
|
1989 |
1999 |
|
Primary forest |
71,589 ha |
69,572 ha |
|
‘Altitude
forest’ |
29,617 ha |
40,247 ha |
|
Secondary forest |
7,142 ha |
3,548 ha |
|
Open gravels |
125 ha |
- |
|
‘Closed’
gravels |
1,255 ha |
1 341 ha |
|
Cloud, shadow & haze |
17,041 ha |
12,063 ha |
|
1999/1989 |
Primary forest |
Upland forest |
Secondary forest |
Open gravels |
‘Closed’ gravels |
Cloud, shadow & haze |
|
Primary forest |
49 114 ha |
8 528 ha |
1 825 ha |
22 ha |
208 ha |
9 874 ha |
|
‘Altitude
forest’ |
12 380 ha |
18 511 ha |
3 302 ha |
16.57 ha |
281 ha |
4 753 ha |
|
Secondary forest |
574 ha |
934 ha |
1 195 ha |
25 ha |
272 ha |
514 ha |
|
Open gravels |
465 ha |
104 ha |
148 ha |
50 ha |
376 ha |
198 ha |
|
Cloud, shadow & haze |
8 028 ha |
1 540 ha |
672 ha |
2 ha |
118 ha |
1 702 ha |
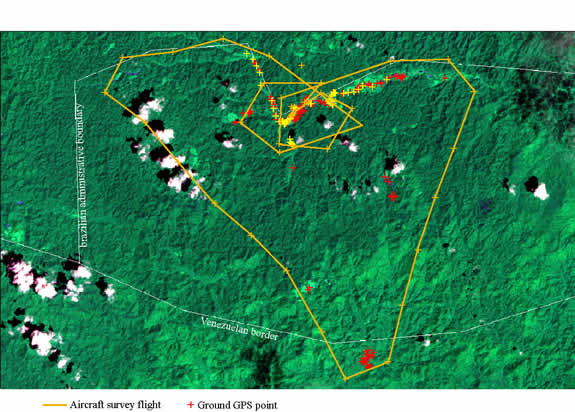
Figure 3: GPS ground-truthing points and course of overflight at Homoxi
Cartography and ground truthing
The classifications were guided by the ground truthing operations that were undertaken as part of the Homoxi expedition. More than 150 GPS points were taken, detailing natural habitats, airstrips and indigenous gardens in addition to the mining sites. These data were supplemented by interviews and resource mapping operations, carried out by the team’s anthropologists with Yanomami informants. Satellite images, printed out at 1:200,000 and 1:100,000 scale, were also shown to the Yanomami, who used them in their discussions of local toponyms and community migrations. The overall result was an in-depth ethnological mapping, with significant implications for understanding the occupation of space by the Yanomami communities in the region.
Results of interpretation and estimation of areas affected by mining
Regions affected by placers, and their dynamics
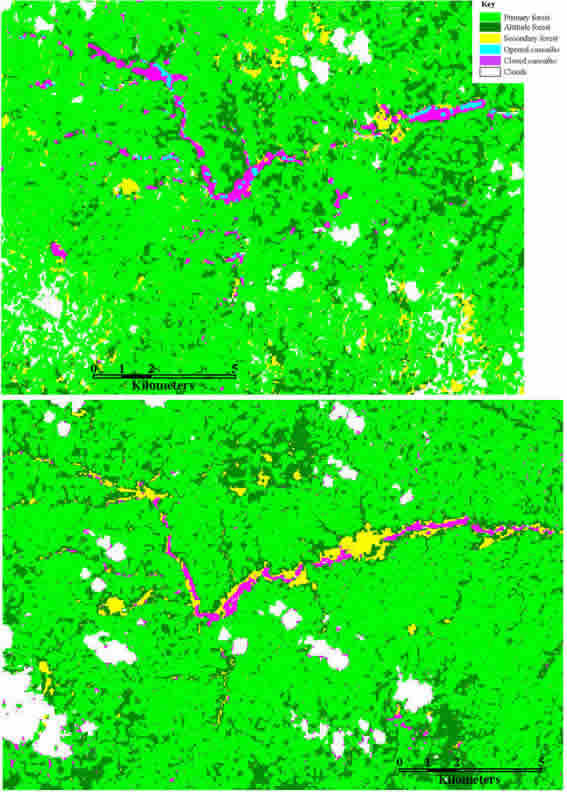
As has been mentioned, it is impossible to calculate exactly the total area affected by mining activities. The images are too far apart in time (areas may have been mined and then hidden by secoindary vegetation in the interval), the secondary forests along the rivers cannot be distinguished with certainty from those caused by indigenous agriculture, and the views are partially obscured by clouds. As has also been mentioned, comparison between the two scenes has allowed us to identify three soil states in relation to the garimpo. The first is that of placer activity (bare soil and gravel) shown in pink on the images. This is unlikely to be confused with sites of indigenous agriculture. However, its area may well be under-estimated, as small placer sites are likely to have avoided detection (given that a Landsat pixel measures 900m2). The environmental impact of these small placer sites is inevitably lower, although they will nonetheless have contributed towards mercury contamination (which cannot therefore be mapped spatially with accuracy). The absence of this spectral response from the 1999 image suggests the cessation of mining activities (at least of a medium- to large-scale) by that time.
The second type of habitat – mining sites in which the vegetation has begun to recover to varying degrees – is characterised by its openness. There are few trees, the vegetation being made up of patch herbaceous/grass and shrub cover. This provides a similar spectral response to natural savanna, from which it is also not dissimilar physiognomically. In the Homoxi region (as defined in Fig. 5) there is no high-altitude savanna, so automatic detection is possible for comparison between the two images. This vegetation is transitional in nature, the speed of regeneration varying greatly with the nature of the substrate, proximity to forest, soil humidity, etc. The process can be a very long one in the areas where conditions are least suitable for regeneration. There appear, for example, to be areas that had already reached this transitional stage by 1989 (i.e. had already been abandoned), and were still showing the same spectral response in 1999.
The third state of the worked areas is secondary forest, which has already been discussed at length.
Considering the Homoxi region sensu strictu,[3] the ‘open’ and ‘closed’ gravel areas covered 93 and 461 ha respectively in 1989 and 0 and 271 in 1999: a significant diminuition between the two dates. This was the most heavily mined part of the region, with 75% of the open gravels (i.e. placers under exploitation) in 1989. Of the 271 ha of closed gravels in 1999 only 120 were shown as open gravel in 1989, the rest having been forest at the earlier date. This demonstrates that mining activity continued to spread after 1989. Another indication of this continued development is appearance of new airstrips (Macarrão, Pau Grosso and Julio de Blefe) between 1989 and 1999.
The total area affected by mining in the Homoxi region can be estimated to be less than 700ha, without counting the secondary forests. Although this is only a relatively small proportion of the total land area (less than 4%), it nevertheless represents significant damage to the local environment. This is primarily because the mining took place along the watercourses, which are areas of considerable importance to the Yanomami economy. In addition, the pollution caused by these mining activities could be rapidly dispersed over great distances via the river system. It is not known exactly how many garimpeiros worked in the Homoxi region, but the area worked suggests that this number may have been as high as 7,000.[4] The presence of so many people in a delicate environment can have significant consequences.
Table 2: Results of classifications of the Homoxi zone (21,700 ha)
|
|
1989 |
1999 |
|
Primary forest |
16,626 ha |
15,559 ha |
|
‘Altitude
forest’ |
3,033 ha |
4,405 ha |
|
Secondary forest |
699 ha |
552 ha |
|
Open gravels |
93 ha |
- |
|
‘Closed’
gravels |
461 ha |
271 ha |
|
Cloud, shadow & haze |
1,000 ha |
1,125 ha |
|
1999/1989 |
Primary forest |
Upland forest |
Secondary forest |
Open gravels |
Closed gravels |
Cloud, shadow & haze |
|
Primary forest |
12 844 ha |
1 952 ha |
123 ha |
13 ha |
82 ha |
545 ha |
|
‘Altitude
forest’ |
2 677 ha |
913 ha |
390 ha |
16 ha |
137 ha |
270 ha |
|
Secondary forest |
142 ha |
79 ha |
140 ha |
18 ha |
153 ha |
19 ha |
|
Open gravels |
94 ha |
22 ha |
20 ha |
43 ha |
77 ha |
13 ha |
|
Cloud, shadow & haze |
868 ha |
65 ha |
26 ha |
2 ha |
12 ha |
152 ha |
Calculation of natural regeneration
The remote sensing images, in particular the comparison between the 1989 and 1999 images, allow us to make certain deductions regarding natural regeneration, bearing in mind the limitations pointed out above and the inherent difficulties in defining the origins of secondary forests. Remote sensing images measure little more than vegetation density and the geometry of cover in a given place (see discussion of secondary forests). It does not, for example, permit one to distinguish the subtle differences between an old secondary forest (i.e. with a differentiated canopy rather than a flat single-species one) and primary forest. It is therefore important that a study of this nature should be accompanied by botanical observations on the ground such as were made during the Homoxi expedition.
Nevertheless, remote sensing has provided some valuable insights into the extent of vegetation damage and subsequent recuperation in the Homoxi region. Of the area classified as gravels in 1989, for example, 79% was reclassified as forest (secondary) in 1999 and 2% was under clouds. The fact that 17% was reclassified as primary forest, 30% as secondary forest and 27% as ‘altitude forest’ emphasises the need for caution in distinguishing between these forest categories (given that, in reality, all of the forest that has regenerated since 1989 is by definition secondary). The areas still covered in gravels in 1999 can be taken to be those which had been most intensely exploited. As one would expect, a greater proportion (50%) of the ‘open gravels’ in 1989 were still classified as gravels in 1999 than were the closed gravels, of which only 17% were still classified as gravels.
Table 3: Results of classifications of the Garimpo Jeremias zone (4,960 ha)
|
|
1989 |
1999 |
|
Primary forest |
3,665 ha |
3,545 ha |
|
‘Altitude
forest’ |
812 ha |
878 ha |
|
Secondary forest |
137 ha |
238 ha |
|
Open gravels |
53 ha |
- |
|
‘Closed’ gravels |
262 ha |
123 ha |
|
Cloud, shadow & haze |
101 ha |
247 ha |
|
1999/1989 |
Primary forest |
Upland forest |
Secondary forest |
Open gravels |
Closed gravels |
Cloud, shadow & haze |
|
Primary forest |
2 877 ha |
525 ha |
17 ha |
9 ha |
44 ha |
72 ha |
|
‘Altitude
forest’ |
504 ha |
156 ha |
51 ha |
9 ha |
68 ha |
23 ha |
|
Secondary forest |
48 ha |
29 ha |
60 ha |
13 ha |
85 ha |
3 ha |
|
Open gravels |
26 ha |
8 ha |
8 ha |
21 ha |
59 ha |
1 ha |
|
Cloud, shadow & haze |
210 ha |
28 ha |
1 ha |
1 ha |
6 ha |
1 ha |
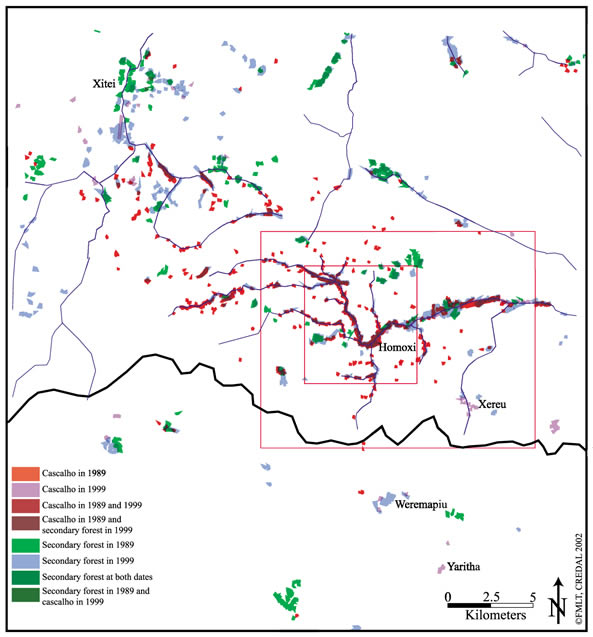
Figure 5: Impact and evolution of gold mining in the
Homoxi-Xitei-Yaritha
area
Conclusions regarding detection
of the presence of indigenous communities
As has been mentioned above, it is very difficult to rely upon the quantity of secondary forest as a means of estimating indigenous occupation of an area given that communities may exploit several old gardens simultaneously and also draw resources from gardens established some distance from their settlements. Nevertheless the regular appearance of new areas of secondary forest (given that newly cultivated areas rapidly take on the spectral characteristics of secondary forest) can provide an idea of the dynamics of indigenous movements within a region. Considering the Homoxi region and the more restricted ‘Jeremias Garimpo’, the areas of secondary forest present in 1989 (48 and 142 ha respectively) appear small - particularly if some of this secondary forest is due to mining.
It is of greater interest to use the
results of remote sensing analysis to track the migrations of the indigenous
communities over time. This has been
achieved at Homoxi with the help of interview data combined with identification
and geo-referencing of named sites on the ground. Thus, for example, one can trace the development of new clearings
at Xere u and Wiramapi u (absent in 1989 but present in 199), and monitor
the transformation from active clearings to secondary forest at sites of
occupation such as Wakaxëno u and Paxokiki u. These
migrations have considerable relevance to the present study, and are described
in detail in the Introduction.
Table 4: Sizes of gardens and secondary forests due to agriculture, measured with remote sensing data
|
Place |
Open gardens (ha) |
Secondary forests |
|
Hoomoxi Yano or Wakaxëno u |
|
26.0 |
|
Thoothothopi |
|
27.4 |
|
Potomatha |
|
4.1 |
|
Tirei u |
|
35.3 |
|
Xere u 1 |
|
12.6 |
|
Xere u 2 |
9.24 |
13.0 |
|
Yar«tha |
20.45 |
|
|
W«ramapi u |
9.1 |
46.5 |
|
Pau Grosso |
|
5.3 |
|
Macarrão |
|
?? |
|
Apiahipiu |
|
3.9 |
|
Waitaropi u |
|
25.1 |